When running a lightning node it it always interesting to to see what is going on in the background. Of course, nobody want’s to login all the time with the cli to examine the current statistics. It is not only a security risk but also very time consuming and not very pleasing to the eyes. But there is help and that’s the lighntning node Grafana Dashboard.
Grafana is an open source tool to analyse and monitor data. It has an active community and a lot of connectors to other products, which makes it the perfect solution for our job. However Grafana alone wouln’t be enough. Grafana only displays the data. We also need a tool to gather and store all of it. Therefor we use Prometheus. Prometheus will grab the necessary data and stores them in a time series database Grafana can access.
Prometheus plugin
First we need to install the Prometheus plugin for c-lightning. Those plugins need Python to run. On Linux environments Python is easily installed by one of the many package managers like apt.
sudo apt-get install python3 pipThere are several option how to run a c-lightning plugin. The easiest would be to place the plugin in the plugin directory within your lightning installation directory. If you don’t have that directory yet you should create it.
mkdir ~/.lightning/pluginsNext you should create the prometheus directory and download the necessary files. This can also easily be done within the shell. If you don’t have wget just copy the files into your prometheus directory within the plugins folder.
mkdir ~/.lightning/plugins/prometheus && cd ~/.lightning/plugins/prometheus
wget https://raw.githubusercontent.com/lightningd/plugins/master/prometheus/prometheus.py
wget https://raw.githubusercontent.com/lightningd/plugins/master/prometheus/requirements.txt
The requirements.txt file contains additional packages for python. You can install them with pip.
pip3 install -r requirements.txtThe last important step is to mark the python script as executable. If you skip this step it won’t be able to load.
chmod +x ./prometheus.pyThat’s it. If you now restart your lightning node the plugin should be loaded. You can test it by executing a rest request to get the metrics. The default port is 9750.
curl localhost:9750/metricsPrometheus
Prometheus can be downloaded from the official website. Afterwards we have to extract the package and cd into the installation folder. In that folder we can create the configuration file prometheus.yml .
tar xvfz prometheus-*.tar.gz
cd prometheus-*
touch prometheus.yml
The config itself is pretty simple. The important part is the job titled lightningd which is targeting our prometheus plugin.
global:
  scrape_interval:     15s
  evaluation_interval: 15s
scrape_configs:
  - job_name: 'lightningd'
    static_configs:
      - targets: ['localhost:9750']
Prometheus can now be started with the created config.
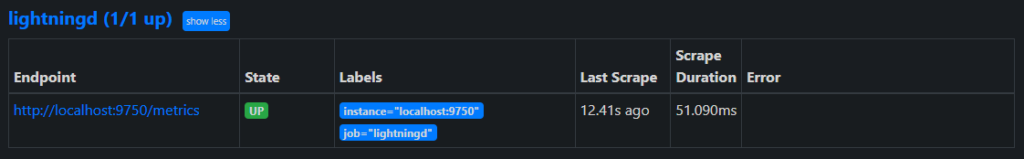
./prometheus --config.file=prometheus.ymlPrometheus has a webinterface reachable at default port 9090 we can use to see the status of our job and check if everything is up and running. To access it just visit http://localhost:9090/targets.
Grafana
Next, we need to download and install Grafana on our machine. The download is available on the official homepage. Make sure to replace the current version to this script.
sudo apt-get install -y adduser libfontconfig1
wget https://dl.grafana.com/oss/release/grafana_8.0.6_amd64.deb
sudo dpkg -i grafana_8.0.6_amd64.deb
Grafana is by default reachable at http://localhost:3000. The default user and password is admin/admin. You should change the password as soon as possible.
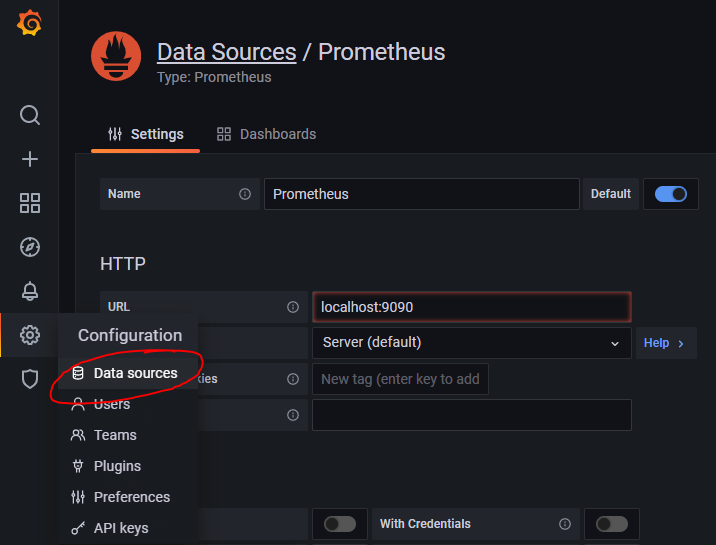
Afterwards we have to add Prometheus as data source. This can be done by clicking on „Data sources“ within the Configuration menu and adding Prometheus as data source. The default setting should be perfect. You only need to take care, that the URL to our Prometheus instance is correct.
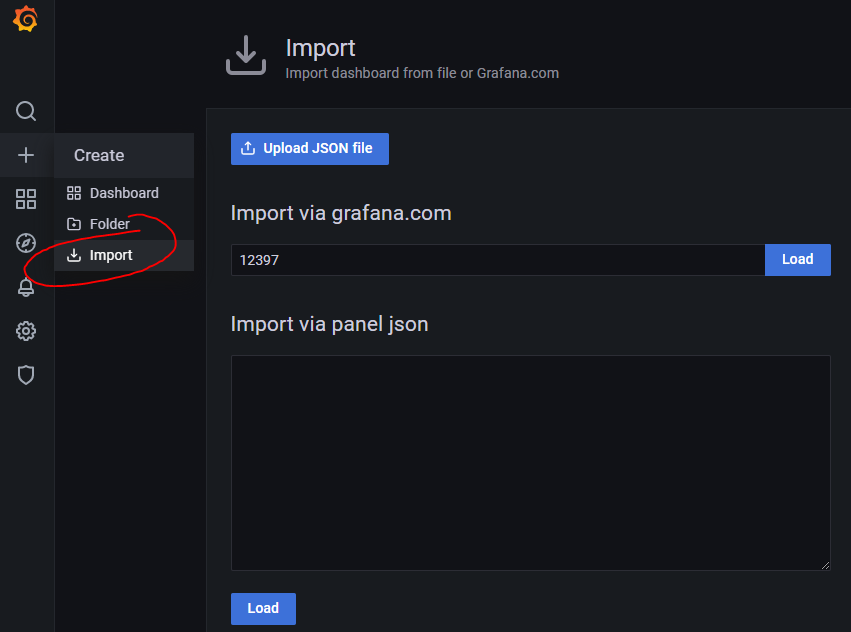
As last step we have to install the c-lightning Dashboard. You can find a good one here. To install it, navigate to the import menu and type the number 12397 into the textbox.
Thats it. Your dashboard should now be up and running.